Updated June 2026 · 10-minute read
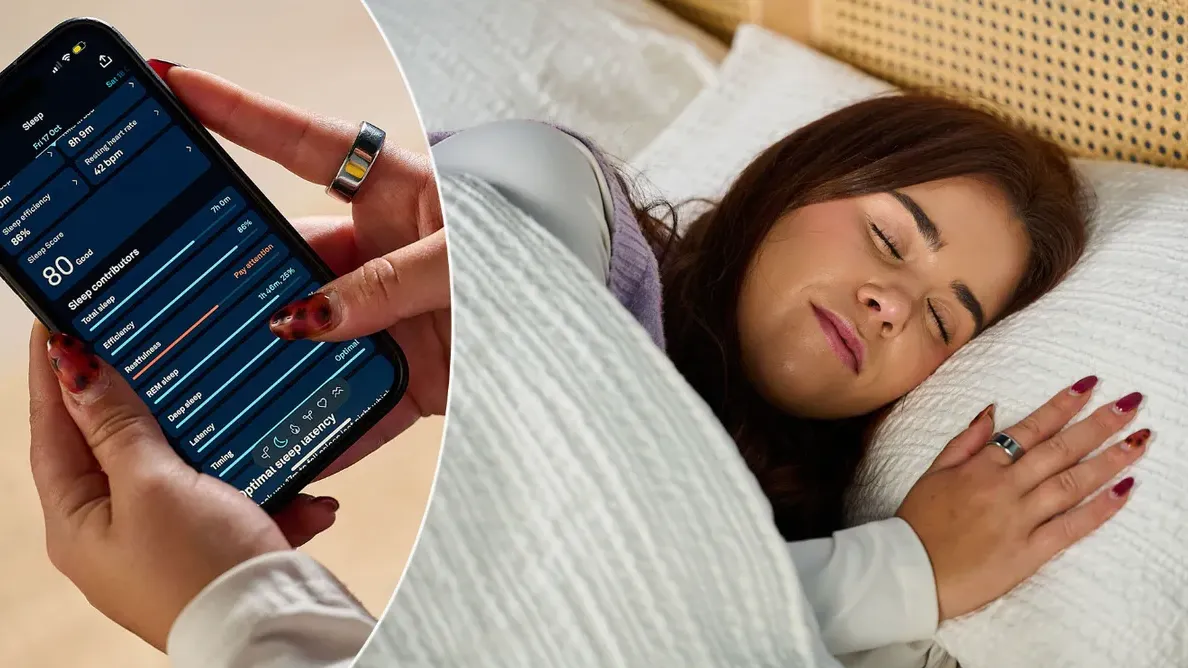
Every morning your Oura Ring tells you how much deep sleep, REM sleep, and light sleep you got. Most users accept the number at face value. But what is actually happening inside that titanium band while you sleep? How does a ring on your finger know you were in REM at 2:47am?
The answer involves a surprisingly sophisticated pipeline of optical sensors, signal processing algorithms, and a machine learning classifier trained on thousands of hours of simultaneous wearable and clinical sleep data. This article walks through exactly how that pipeline works.
Step 1: The Optical Sensor Array Collects Raw Light Data
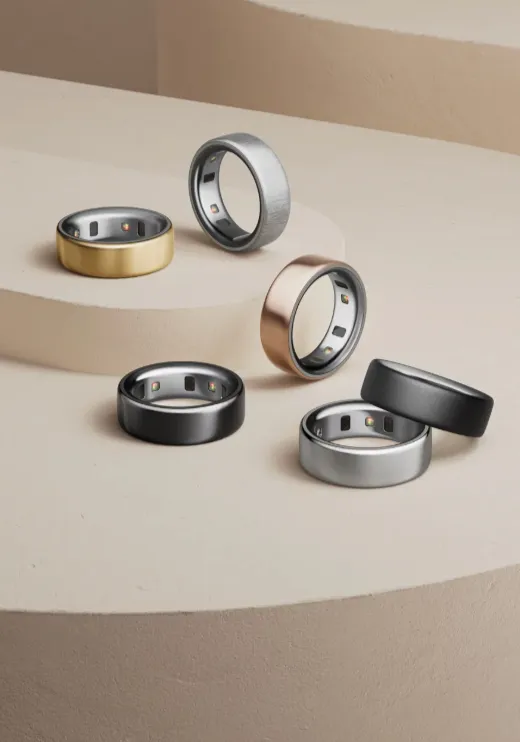
The Oura Ring 4 contains six LED emitters and four photodetectors on the inner surface of the band, positioned against the palmar side of your finger. During sleep the ring cycles through its LEDs continuously, typically every few seconds, illuminating the tissue beneath the skin and measuring how much light returns to the photodetectors.
Different LED wavelengths penetrate tissue to different depths and are absorbed differently by oxygenated and deoxygenated haemoglobin. Green LEDs (around 530nm) are absorbed strongly by blood and produce a clear pulsatile signal tied to heartbeat. Infrared LEDs penetrate deeper and allow a different look at the same blood volume changes. Red LEDs, used primarily for SpO2 estimation, interact differently with oxygenated versus deoxygenated blood.
The raw output from all of this is a stream of intensity readings across wavelengths, arriving many times per second, containing the heartbeat signal buried inside a much larger background signal from tissue, bone, and venous blood. This raw stream is not yet useful. It has to be processed.
Step 2: Signal Processing Extracts Heart Rate and HRV
The first processing stage extracts the heart rate signal from the raw photoplethysmography (PPG) data. A high-pass digital filter removes the large, slow-moving background component (the DC component) and leaves the small, pulsatile variation caused by each heartbeat (the AC component).
Peak detection algorithms then identify each individual heartbeat in this cleaned signal, locating the timing of each pulse peak. The interval between successive peaks (the inter-beat interval, or IBI) is the raw material for two critical metrics:
Heart rate: Calculated as 60 divided by the average IBI in seconds
HRV (RMSSD): The root mean square of successive differences between consecutive IBIs, which measures beat-to-beat variability
Both metrics are computed continuously throughout the night, producing time series of HR and HRV values that change across different sleep stages. This is the key insight that makes wearable sleep staging possible: different sleep stages produce measurably different cardiac signatures.
Step 3: The Accelerometer Adds Movement Data
Alongside the optical sensor, the ring contains a 3-axis accelerometer sampling your finger's movement at 50Hz. This sensor contributes two important things to the sleep staging model.
First, it detects gross body movement. Tossing and turning, changing position, and restless movement all produce distinct accelerometer signatures that help identify wakefulness and light sleep periods. Sustained stillness is a precondition for deep sleep.
Second, and less obviously, the accelerometer data helps clean up the optical signal during periods of movement. When your hand moves, the optical sensor produces artefacts that are not heartbeat-related. The accelerometer signal is used to identify these movement periods and flag the corresponding optical data as potentially unreliable, so the downstream algorithms can weight it appropriately.
Step 4: Feature Extraction Across Multiple Time Windows
The sleep staging AI does not operate on raw sample-by-sample data. Instead, a feature extraction layer computes summary statistics across sliding time windows of typically 30 seconds to 5 minutes. These features include:
Mean heart rate over the window
HRV (RMSSD) over the window
Heart rate variability in specific frequency bands (LF/HF ratio from spectral analysis)
Respiratory rate estimated from the slow oscillation in the PPG signal caused by breathing
Movement intensity from the accelerometer
Body temperature relative to personal baseline
Time since sleep onset and time of night
This feature vector, updated every 30 seconds, is the actual input to the machine learning classifier. The raw sensor data has been compressed into a meaningful numerical representation of your physiological state at each moment of the night.
Step 5: The Machine Learning Classifier Assigns Sleep Stages
The classifier takes the feature vector as input and outputs a probability distribution across four sleep stage categories: Awake, Light (NREM 1 and 2), Deep (NREM 3, slow-wave sleep), and REM.
Oura does not publicly disclose the exact architecture of their classifier, but published research from the wearable sleep tracking field generally uses one of two approaches for this type of problem.
Random forest classifiers are ensemble models that combine hundreds of individual decision trees, each trained on a random subset of the data and features. The ensemble vote determines the final classification. Random forests work well for this problem because the feature space (HR, HRV, movement, temperature) has clear decision boundaries for some transitions (high movement strongly predicts wakefulness; very low HR and high HRV strongly suggests deep sleep).
Recurrent neural networks (RNNs) or LSTMs are deep learning models that explicitly model the temporal sequence of observations. Sleep staging is inherently sequential: you cannot jump from wakefulness directly to REM without passing through lighter NREM stages. An LSTM can learn these transition rules from training data and use the history of previous stages to inform the current classification.
Published Oura research papers and patent filings suggest they use a combination of approaches, with different models used for initial classification and for smoothing the sequence of predicted stages to ensure physiologically plausible stage transitions.
How the Model Was Trained
Training a sleep staging classifier requires labelled data: simultaneous recordings of wearable sensor data and gold-standard sleep stage labels. The gold standard is polysomnography (PSG), the clinical sleep study in which electrodes attached to the scalp directly measure the brain's electrical activity (EEG), which reliably distinguishes sleep stages in a way that no wearable can match.
Oura has published that their training data includes thousands of nights of simultaneous Oura ring and PSG recordings collected in sleep research partnerships. The classifier learns which combinations of ring sensor features correspond to which PSG-confirmed sleep stages across this dataset.
The training process optimises the classifier to minimise disagreement with PSG labels on the training data, then validates performance on separate held-out data that was not used in training. Published validation results for Oura Ring 3 showed epoch-by-epoch agreement with PSG of around 79 to 81 percent, which is comparable to the agreement between two human experts scoring the same PSG recording.
Why the AI Sometimes Gets It Wrong
Understanding how the classifier works makes its failure modes predictable.
Light sleep and REM confusion. Light NREM and REM sleep are the hardest pair to distinguish from wrist or finger optical data. Both stages have higher heart rates and more variability than deep sleep, and without the direct EEG signal showing the characteristic rapid eye movements of REM, the classifier relies on subtle cardiac and respiratory signatures that overlap significantly between the two stages. Most wearable sleep trackers, not just Oura, show the highest error rate at the light/REM boundary.
Unusual physiology. The classifier was trained on a population of research subjects. Individuals whose resting heart rate, HRV range, or respiratory patterns fall far outside the training distribution may see worse performance because the feature values they produce do not map cleanly onto the learned stage boundaries.
Alcohol and medications. Both significantly alter the cardiac signatures of sleep stages in ways that can confuse the classifier. Alcohol suppresses REM in the second half of the night and elevates heart rate throughout, potentially causing the model to misclassify some periods.
Frequently Asked Questions
Is Oura Ring sleep staging as accurate as a clinical sleep study?
No, and Oura does not claim it is. A clinical polysomnography study uses direct EEG brain wave measurement plus eye movement and muscle sensors, giving a complete picture that no wearable can replicate. Oura's published validation shows around 79 to 81 percent epoch agreement with PSG, which is useful for trend monitoring and general sleep quality tracking. The absolute stage breakdown on any single night should be treated as an estimate, not a clinical measurement. The value is in tracking your personal trends over time, not in precise staging on individual nights.
Why does Oura sometimes show no deep sleep at all?
Deep sleep detection is the most conservative classification the model makes because deep sleep has the most distinct signature: very low heart rate, very high HRV, complete stillness, and slow respiratory patterns all appearing together. If any of these are absent or borderline, the classifier may assign the period to light sleep rather than deep sleep. Alcohol, sleeping in a warm room, high caffeine intake, and sleeping at an unusual time all suppress deep sleep physiologically and will produce genuine reductions in detected deep sleep, not just classifier errors.
Does Oura's AI improve over time as it learns your patterns?
The global model deployed on all rings is not updated based on your individual data in real time. However, Oura does use aggregate anonymised population data from their user base to retrain and improve the model over time, and firmware updates periodically deploy improved classifiers. Additionally, some personalisation happens through your personal baseline calculations: the readiness and sleep score incorporate your own historical averages so that deviations from your normal are detected relative to your personal pattern rather than a population average.
Why is REM sleep harder for wearables to detect than deep sleep?
Deep sleep (slow-wave sleep) produces a very distinct physiological signature: heart rate drops significantly, HRV rises, breathing becomes slow and regular, and the body is completely still. This combination is easy for a classifier to identify. REM sleep is characterised by rapid eye movements and vivid dreaming, but the cardiac signature overlaps significantly with light NREM sleep. Both stages have higher and more variable heart rates than deep sleep. Without an EEG or eye movement sensor, the classifier must use subtle cardiac pattern differences that are less reliable, leading to higher confusion between REM and light sleep.
Technical details in this article draw on published Oura research papers, peer-reviewed wearable sleep staging validation studies, and computer vision and signal processing literature as of June 2026.